Embedded web UI
The pvtx app is a web interface served directly from the device on port 12368. It gives you a browser-based view of the device's revisions, containers, resource usage, configuration, the on-device REST API, and live logs — without the pvr CLI or SSH.
Open a browser and navigate to:
http://<device-ip>:12368/app/
The top navigation has four pages: Home, Stats & Config, API documentation, and Logs.
Home — revision state and transactions
The Home page shows the device's current revision and lets you switch revisions or start a transaction.
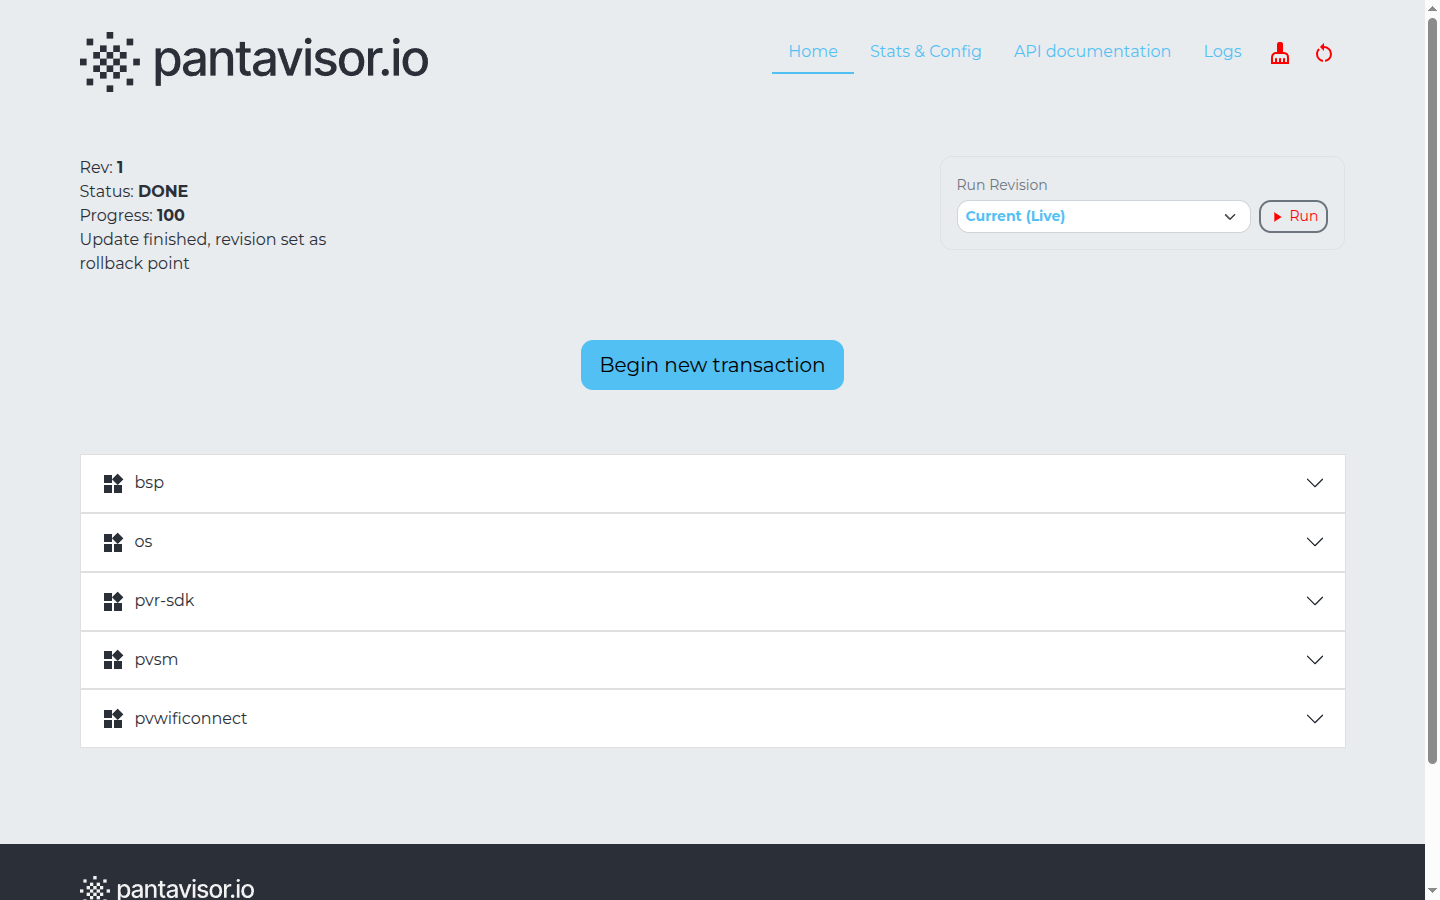
Top-left status block:
- Rev — the current revision number in the device's trail.
- Status —
DONEmeans the current revision is committed and stable. Other states (e.g.TESTING) appear while a revision is being evaluated. - Progress — completion percentage of the current update or boot sequence.
- A status line such as "Update finished, revision set as rollback point".
Run Revision (top-right) — a dropdown to select a revision (Current (Live), Rev 0, Rev 1, …) and a Run button to boot into it.
Begin new transaction — starts a staged update you can apply from a pvexport/.tar.gz package (see API documentation below for the underlying calls).
Containers — each component on the device is an expandable row. On a typical image these include bsp, os, pvr-sdk, pvsm, and application containers such as pvwificonnect.
Stats & Config
The Stats & Config page shows live resource usage, device metadata, and the device configuration.
Device stats

| Field | Description |
|---|---|
| RAM | Used / total memory |
| Swap | Swap space usage |
| Disk usage | Storage partition used / total |
| Reserved | Storage reserved by Pantavisor |
Device Meta and Device Config
Below the stats are two tables:
- Device Meta — read-only, device-reported values: network interfaces (
interfaces.<iface>.ipv4/ipv6), Pantahub connectivity (pantahub.claimed,pantahub.online,pantahub.state), platform info (pantavisor.arch,pantavisor.dtmodel,pantavisor.version, kerneluname), and storage/sysinfo counters. You can also add your own user-metadata key/value entries here. - Device Config — the active Pantavisor configuration keys (for example
creds.host/creds.port,secureboot.mode,wdt.timeout,updater.interval, log and storage paths).
⚠️ Warning — Sensitive values
Device Meta and Device Config include credentials and identifiers (e.g.
creds.id,creds.prn,creds.secret, and SSHauthorized_keys). Treat this page as sensitive and avoid sharing screenshots of it. (That is why only the resource-stats section is shown above.)
API documentation — the pvtx REST API
The API documentation page documents the on-device PVTX REST API — the same actions available from the pvtx CLI (the on-device counterpart to pvcontrol, installed on the device itself — not something you run from your workstation), exposed over HTTP so you can manage the device without any cloud service — you upload pvr export packages directly to the device.
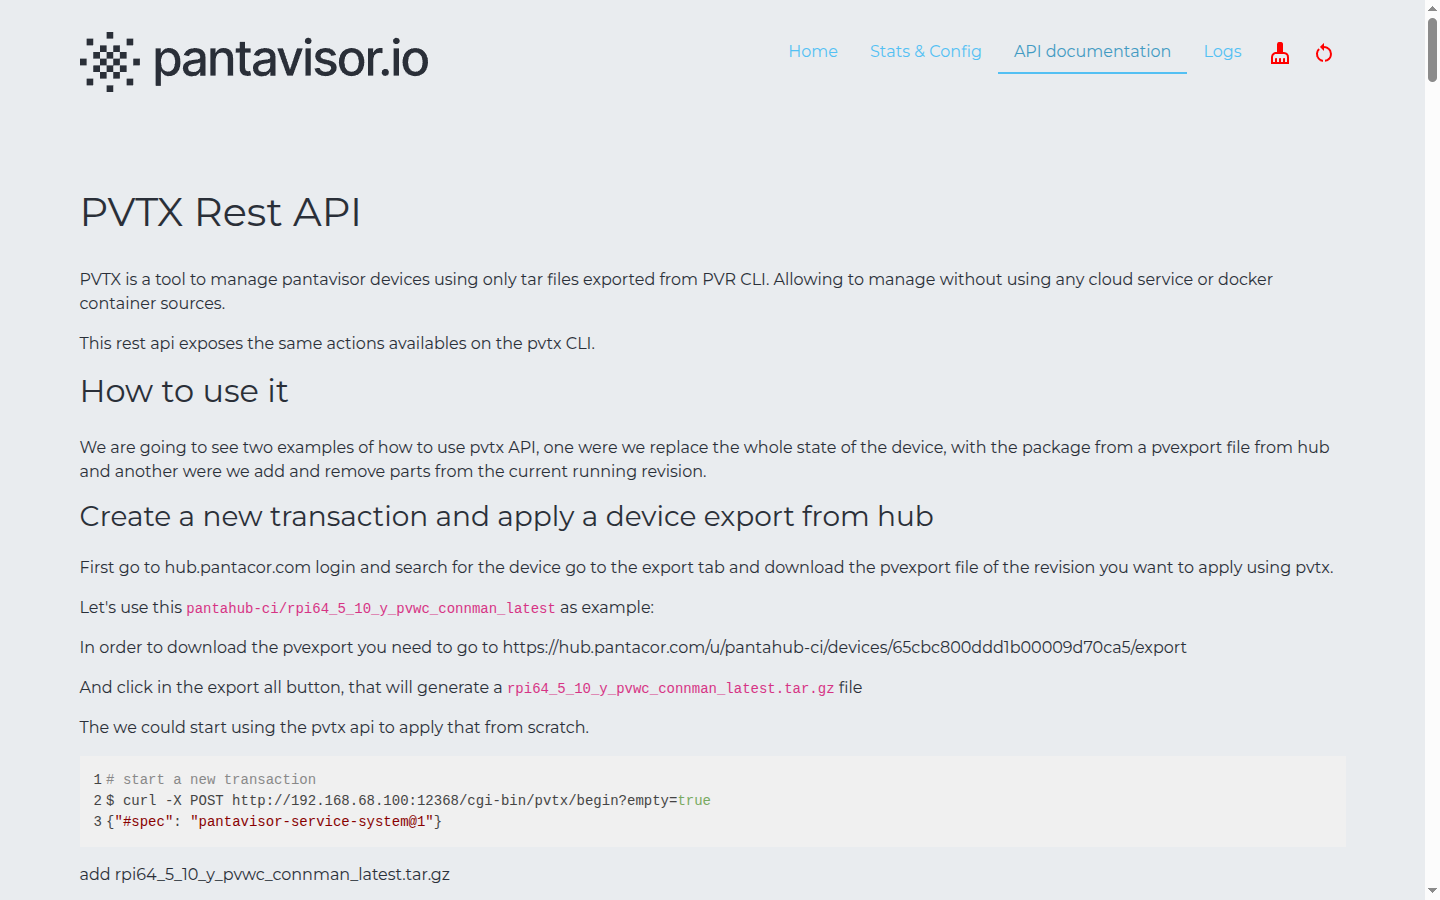
It walks through two workflows with runnable curl examples:
- Replace the whole device state from a
pvexportpackage downloaded from Pantahub. - Add or remove parts of the current running revision.
⚠️ Warning — this is a state-changing transaction, not a read-only query
beginopens a transaction that lateradd/commitcalls apply to the device — it's not safe to run on a live device without reading the full workflow on the API documentation page first (in the pvtx web UI itself) so you know whatadd/commit/cancelsteps come next and what state they leave the device in if interrupted.
For example, starting a fresh transaction:
curl -X POST "http://<device-ip>:12368/cgi-bin/pvtx/begin?empty=true"
Logs
The Logs page streams Pantavisor runtime and container logs directly in the browser.
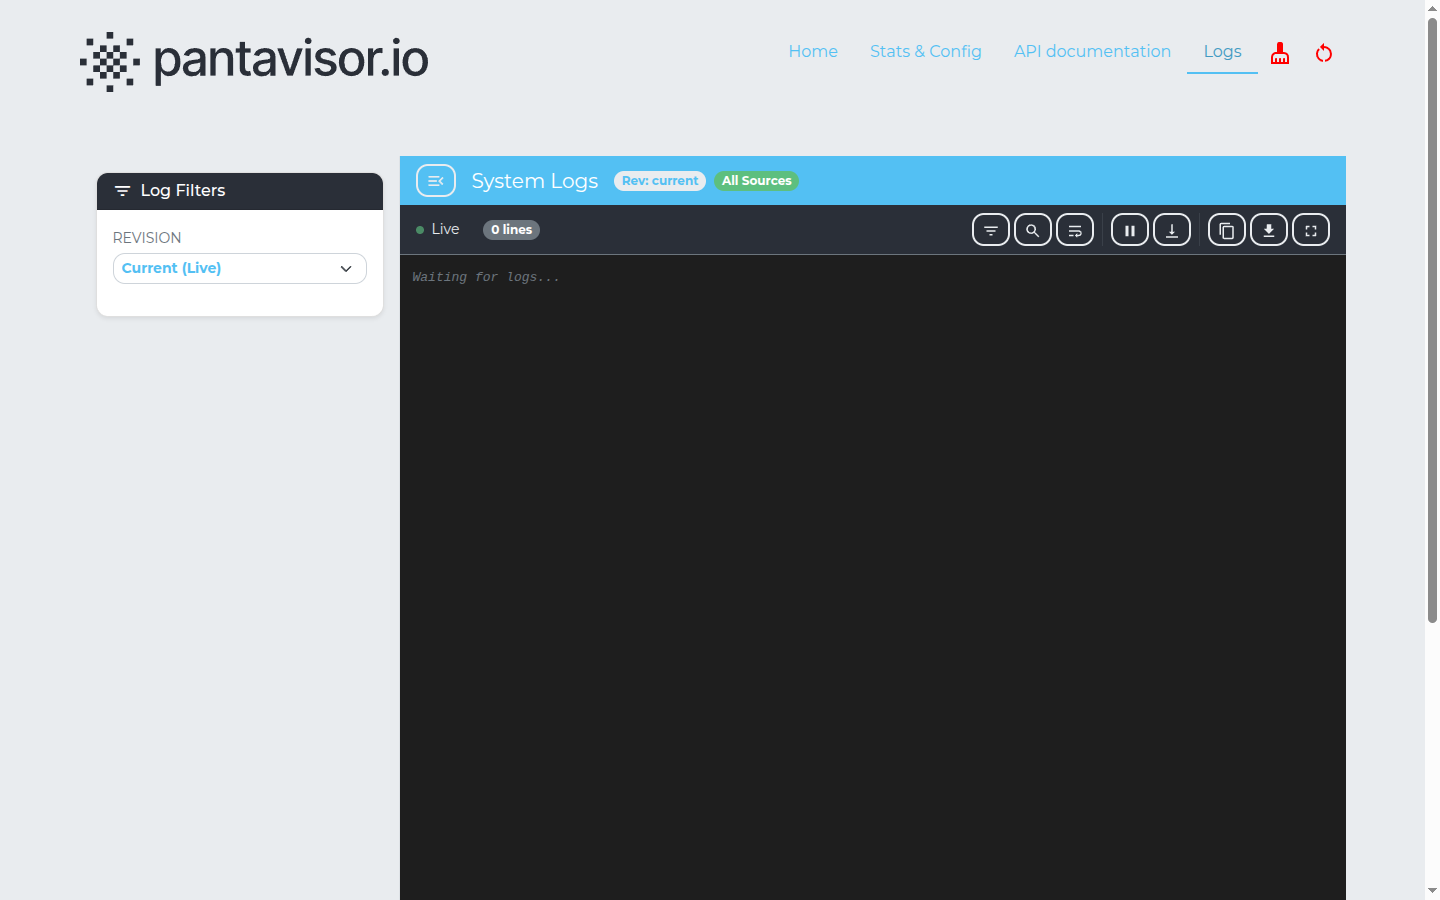
- Log Filters (left) — choose the revision to view logs for (
Current (Live)or a specific revision). - System Logs header — shows the selected revision and source scope (e.g. All Sources), with a Live indicator and line count.
- Toolbar (top-right of the log pane) — filter, search, pause/resume the live stream, download, copy, and full-screen.
This view mirrors the on-device log files under /pantavisor/logs (configurable via the log.dir config key).